Excel charts in PowerPoint: link, embed or use a picture?
The monthly report needs fresh numbers, but the client receiving your deck does not have the source workbook. Which paste option fits a deck you update and a copy they need to edit?
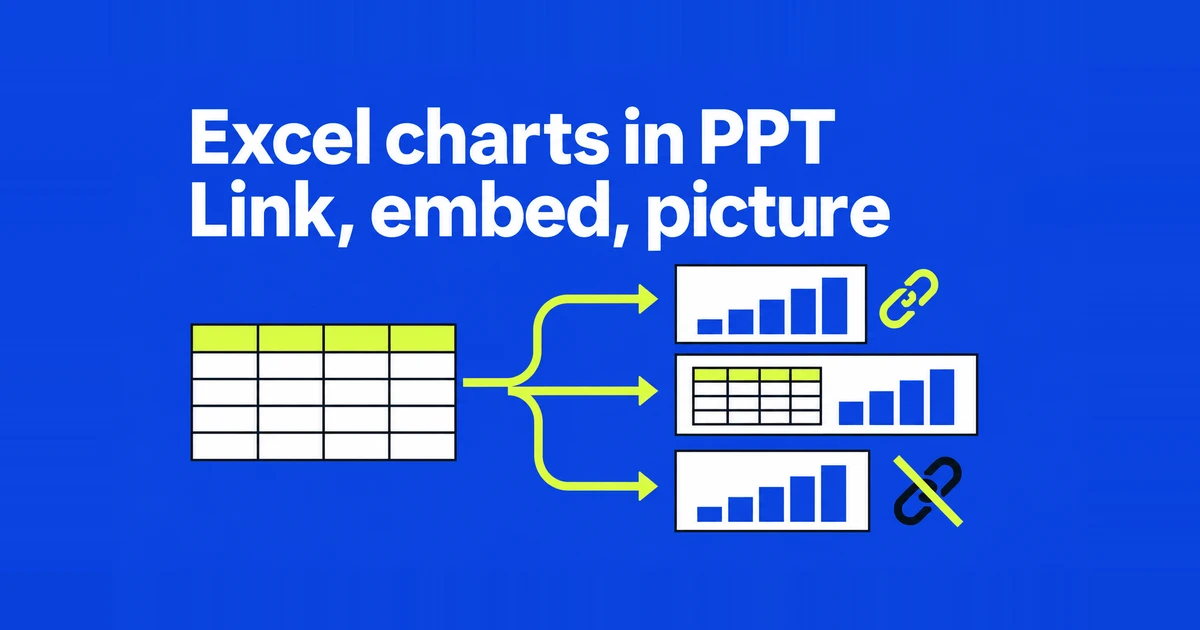
If you enter the same monthly figures in Excel and again in a PowerPoint chart, linking the chart lets you refresh it from the workbook. Sending that deck to a client raises another question: will they only read the approved figures, or enter their own targets and return the file? A picture is enough for viewing; a client editing targets without your workbook needs the relevant data embedded. Your recurring working report and the client’s copy can therefore need different paste choices.
A PowerPoint user on Reddit described the practical conflict: charts needed regular updates, but moving the Excel file made maintaining links troublesome. Embedding looked attractive because the data could travel with the presentation. It also changes where future edits must happen.
The steps below use Windows desktop PowerPoint and Excel, including Microsoft 365, 2024 and 2021. PowerPoint for the web does not offer the same local-workbook linking workflow; a static chart image is an option there. Microsoft separates the desktop and web instructions.
A working report, an editable handoff or a finished graph
| Your next task | Choose | Where the numbers change |
|---|---|---|
| Refresh the monthly deck from the same workbook. | Link Data | The external workbook, followed by a chart update. |
| Let a colleague revise figures using the deck alone. | Embed Workbook | The workbook copy inside the presentation. |
| Deliver the approved graph for viewing. | Picture | Replace the image when the figures change. |
A colleague taking over a linked report must be able to open its Excel source. Sending the deck while leaving the workbook on your own PC gives them no source for next month’s update. Embedding lets them edit data carried inside the deck, although storing that data there can increase the file size. Microsoft’s guide to importing objects explains those source-access and storage requirements.
Consider a finance analyst maintaining a revenue workbook while an account manager revises slide commentary. Keeping numerical edits with the analyst makes a linked working deck useful. A client preparing their own forecast has a different task: they need a portable set of approved inputs, not a dependency on the analyst’s internal folder.
Formatting and data storage are separate choices
Select the chart in Excel, copy it, paste it onto the slide, and open Paste Options. The chart options combine destination-theme or source-formatting choices with either embedding or linking. Picture is another option. Microsoft lists the chart paste choices.
A graph matching the company’s slide theme can therefore still use either storage method. Decide whether it should follow the workbook before choosing its appearance. Otherwise, a chart can look exactly right while holding a copy that will never follow your monthly source updates.
If you copied cells rather than the chart, you are working with a different set of choices, including a PowerPoint table. Microsoft’s worksheet-data instructions cover that workflow. Return to Excel and select the chart itself if a table appears where you expected a graph.
Refresh a linked report and verify one changed value
Save the workbook in its intended working folder before linking its chart. Save the presentation too. In the handoff notes, identify the source workbook and worksheet for each report section. This is particularly useful when a deck combines charts from sales, staffing and finance: a similar filename is a poor substitute for knowing which source supplies a graph.
After changing and saving the Excel values, open File → Info → Edit Links to Files in PowerPoint. Select the source and use Update now. If the related-documents area is absent, save the presentation first. These commands are documented in Microsoft’s external-link instructions.
Choose one revised value as a check. In a practice file, suppose October changes from 120 units to 135. Read the October value on the slide after updating it. If numbers are not displayed, select the chart and use Chart Design → Add Chart Element → Data Labels, choosing a label position. Microsoft documents the chart-element controls. Check any separately typed sentence saying “October: 120 units” as well; that sentence is another editing task.
A 2020 Microsoft Q&A thread describes updated values appearing in the data-editing window while the slide’s chart lagged behind. Close the data window and read the displayed value before approving the report. Save the refreshed deck, reopen it, and inspect the slide you will actually present.
Repair a moved source before handing off ongoing work
If the workbook has moved, use Change Source in the links dialog to select its new location, then update it. Break Link stops the chart following the original workbook; Microsoft describes the retained content as embedded, not converted into a picture. Use the documented link-repair procedure when future updates are still required.
For example, sending both files as email attachments does not tell PowerPoint which new download location to use. Ask the colleague taking over the report to open the workbook, select it as the source if necessary, and verify the revised October figure. Their ability to open the Excel file is part of the handoff, not something demonstrated by your own successful update.
A client who only needs to read the finished report should not have to perform that repair. Produce their delivery copy after the numbers are approved, while retaining the linked deck for the next reporting period.
Embed a workbook for editing without the original
For an embedded chart, select it and open Chart Design → Edit Data → Edit Data in Excel. Change the relevant cells, inspect the chart, and save the presentation. Microsoft documents this chart-editing path. Starting from the chart helps avoid accidentally editing a separately opened source workbook.
In Jon Acampora’s Excel Campus example, embedding creates an independent workbook copy, including data beyond the visible chart. Changes to the original file do not update that copy. A colleague’s revised forecast therefore needs an explicit decision: should those edits also be entered into the master workbook, or should they remain a separate scenario?
Try the handoff with practice data before sending a real forecast. Paste the same chart onto two slides, linking one and embedding the other. After changing October from 120 to 135 in the original workbook, update the linked slide. Open the embedded slide’s data and compare its October value. Then change that copy to 140 and reopen the original workbook. The original should still show 135. Label the embedded slide “proposed target” and the linked slide “current report” so that the exercise also tests how you will explain two legitimate figures to the next editor.
Prepare client-editable data in a separate workbook containing only the inputs they need. For a regional forecast, that might be region, current sales and proposed target. Leave employee-level detail and internal pricing out of this workbook. Build the chart from that prepared table and embed it, rather than using the internal workbook and relying on the slide to show only a small part of it.
After preparing the smaller table, compare its totals, units and reporting period with the approved graph. A regional subtotal and a company-wide total may look similar in a chart but answer different questions. Include a brief note identifying which input the recipient may change and whether the returned deck represents a proposal or an agreed revision.
Finish with a picture or PDF when editing is unnecessary
Complete the numerical and formatting changes before making a picture copy. In the delivery deck, replace the editable chart rather than hiding it behind the image. Keep the working chart in a separate file so that next month’s correction does not require reconstructing the source data.
Run File → Info → Check for Issues → Inspect Document on a delivery copy. PowerPoint’s Document Inspector can identify embedded files or objects but cannot automatically remove all of them. Review those objects and any notes or comments that should not travel. Microsoft explains the PowerPoint inspection limits.
If the recipient only needs the slides, use File → Export → Create PDF/XPS Document. The export options control the page range and whether the output contains slides, notes or other material. Microsoft’s PDF instructions describe these choices. Select the approved slides rather than the presenter’s notes when the recipient only needs the report.
Open the exported file and read the revised figure, axis labels and units at the size the recipient will use. Give the file a reporting-period name and include the figures’ cutoff date in the delivery note. The analyst can then continue updating the working workbook without losing track of which numbers the client received.